

Buffer is one of the most popular social media management platforms in use today. It’s actually been two tools for a while, Buffer Publish for posting and scheduling content to your social media channels, and Buffer Reply, for managing social customer service and community engagement online.
While Buffer has had very good post analytics for a long time, they’ve been working on a richer advanced analytics and reporting tool solution. Buffer recently offered a first look at that tool, Buffer Analyze, to people who signed up for a preview.
In this article, I’ll give you a first look at Buffer Analyze, Buffers new advanced analytics and reporting tool.
Buffer Publish Analytics
As I said, Buffer has had very robust and useful post analytics for years. All versions of Buffer offered post review, Pro and better subscriptions offered much more robust filtering and analysis of posts. While Buffer didn’t offer gorgeous reports like Sprout Social, or Agorapulse, the functionality of their analytics was best of breed.

Buffer Publish Analytics Posts
It was very easy to find your best performing posts on each platform based on the metric of your choice. You could then re-share with the click of a button, or internalize the data and compare it to your least popular content to refine your content strategy.
Buffer also offered insights, which now, with the imminent release of Buffer Analyze have been combined under Overview. In Buffer Analytics, Overview gives you a nice summary of performance information and allows you to drill into specific metrics for each connected social profile.
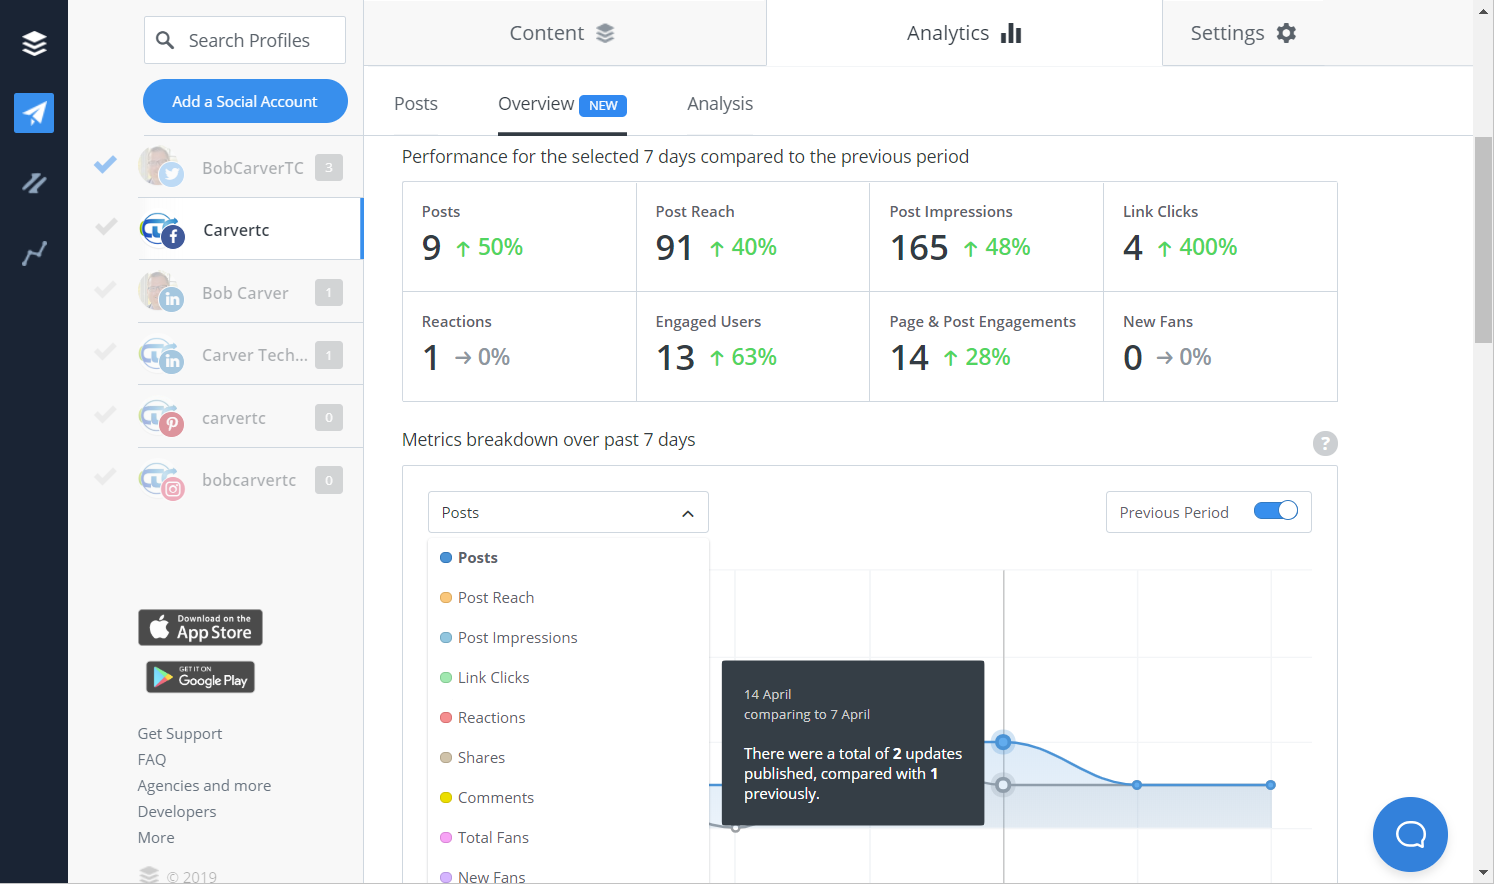
Buffer Publish Analytics Overview - Performance Summary and Metrics
One nice side effect of the development of Buffer Analyze is that the reports in Analytics, such as top metrics, have gotten much prettier, and easier to read.

Buffer Publish Analytics Overview - Top Posts (sorted by impressions)
The Engagements by hour of the day is also very functional, and beautiful allowing you to discover which times during the day your community is seeing and engaging with your content.

Buffer Analytics Overview Engagements by Hour of the Day
One thing you’ll notice is the cleaner, streamlined interface. As Buffer is developing Analyze and reworking the Analytics they are building out new interface elements using a new, streamlined and simplified user experience that we review here.
Buffer Analyze
If you join the Buffer Analyze preview you access it by selecting the Analyze icon in Buffer.

Buffer Analyze
You’ll notice several things right off the bat. First, the Analyze UI is broken into three areas, a Dashboard, channels, and tools. The only channels currently supported are Facebook, Twitter, and Instagram. The tools we’ll cover shortly. The dashboard is what you see in front of you. In theory a nice, simple layout of how your channels are performing compared with the previous day.
It’s time to remember that this tool is still new, and we’re getting an early look. Those numbers on the dashboard didn’t seem right to me and when I drilled into my Twitter channel, I got different performance data.

Buffer Analyze Twitter Performance Summary
It looks like something’s quite wired up correctly under the hood there, but, once that’s fixed the dashboard will serve its purpose by giving you a snapshot of the day's performance.
Channels: Overview and Posts
Each channel has Overview reports, Post reports, and Answers. Overview is very similar to the overview page currently available in Buffer Publish Analytics for all plans with advanced analytics. The reports are large, easy to read, and very pretty.
You can hover over stats to get specifics about the data.

Buffer Analyze Facebook Performance
Many reports allow you to select the metrics you wish to view, and compare them to the previous time frame. You can select from a 7, 28, 30, 90 day, previous day, or a custom day range.
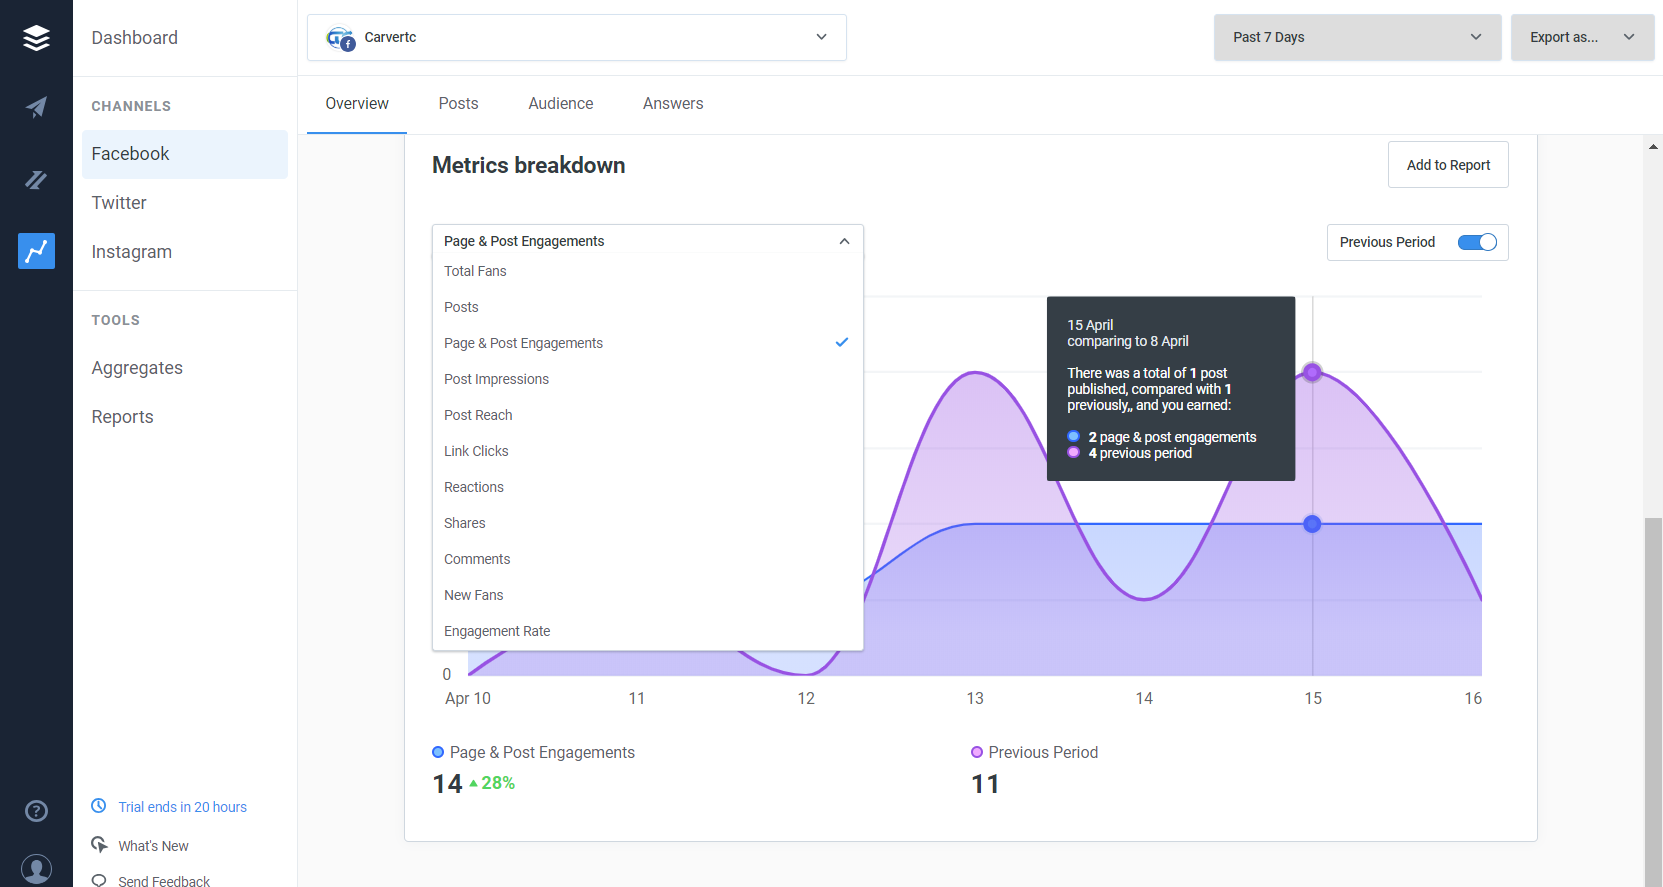
Buffer Analyze Facebook Metrics
Different channels have different reports as part of Overview. Twitter, for example, has Hourly Engagements whereas Facebook does not.
Posts reports, has more than Buffer Analytics. It gives you a nice summary of post performance, and hashtag performance on the channel, for every channel.

Buffer Analyze Post and Hashtag Performance Summary
Like Analytics, Analyze also lets you filter, and sort your posts by impressions, reach, date, engagement rate, reactions and so forth. One notable addition to post filtering is the ability to filter by keyword and hashtag.

Buffer Analyze Tweet Breakdown
Another improvement is the impressions metric. For a long time, Buffer Analytics would show “Potential Reach” which was the total of your followers plus the total followers of anyone who shared your post. But all your posts aren’t seen by all of your followers, or all the followers of people who share your posts. Who sees it and how many impressions it makes depends on a number of factors specific to each social network’s algorithm. That makes it really nice to see this Impressions metric in both Analytics and Analyze which shows you the actual number of impressions for each post.
Channels: Answers
Answers reports are one of the most compelling reasons to try Buffer Analyze. Answers analyzes your data and provides you with actionable insights. It provides a quick overview followed by data that shows the best day to post on the channel.
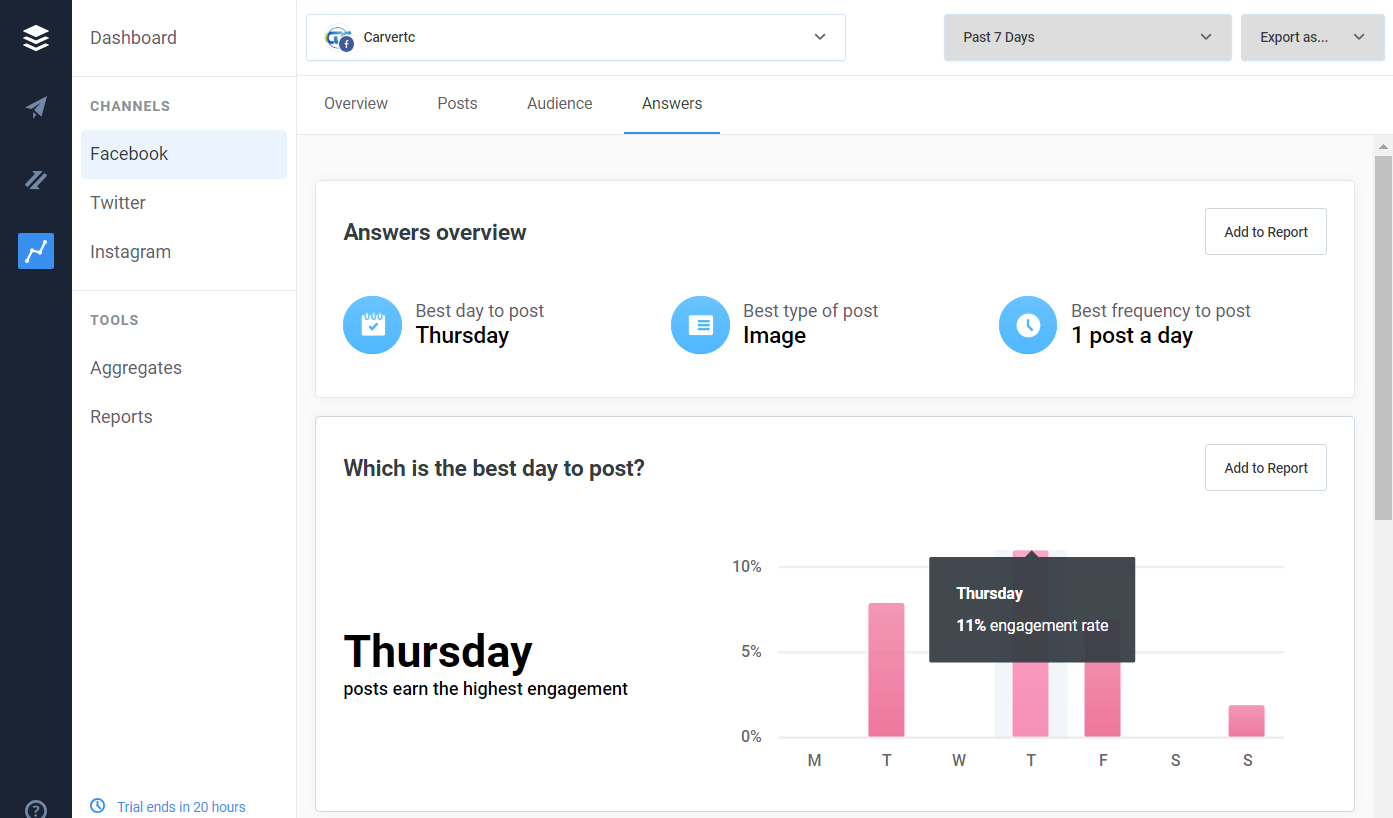
Buffer Analyze Answers
It also shows you which types of posts are getting the most engagement and your best frequency for posting.

Buffer Analyze Answers
What days, times, and types of content to post are the three most frequently asked questions in content marketing. Multiple sources publish “best times to post” articles once, twice, or more each year. We always tell our clients to look at their own data to discover what works best with their audience. Buffer Analyze Answers does that for you using your data.
Facebook and Instagram have additional reports. Audience reports show audience demographic data taken from Facebook Insights including audience Overview, top gender and age, top cities, and top countries.

Buffer Analyze Facebook Audience
In addition to audience data, Instagram breaks out metrics for Stories, separately from posts allowing you to track and optimize your stories independently.
Tools
Currently Analyze has two tools, Aggregates, and Reports. Aggregates are just that, a roll-up of overview, audience, engagements, and impression data from all the channels available in Analyze.

Buffer Analyze Aggregates Tool
While Aggregates is a nice summary of the channels being measured, you have to keep in mind that Analyze doesn’t collect data for all social networks. Specifically LinkedIn, and Pinterest aren’t supported yet, so if you do a lot of marketing on those networks it’s not going to help you much.
For Facebook, Twitter, and Instagram, the Reports tool is very nice. You may have noticed each widget on each page has an Add to Report button in the top right.

Buffer Analyze Add to Report
When you click Add to Report you have the option of adding the data to a new report that you create, or to an existing report.

Buffer Analyze Create Report
Select Reports to see all reports that have been created.

Buffer Analyze Reports Tool
Reports are white labeled. You can add your logo and a report description to a report, then export it as PDF files for printing and sharing.

Buffer Analyze Report Created
Analytics vs Analyze - Pricing and the Future
So there are some questions here. Analytics available for Buffer Publish Pro and above are very good. It doesn’t have the Answers feature or the elegant reporting of Analyze, but post performance analysis is very good. This is an early look at Analyze, and Buffer is currently charging by the number of social accounts per their Analyze FAQ.

Buffer Analyze Pricing
The question is, once Buffer Analyze is released what will become of Buffer Publish Analytics? While I was comparing the user new user experience in Buffer Publish I was having difficulty finding some of my favorite features so I reached out to Buffer’s VP of Marketing, Kevan Lee. Here’s what he said about how Analyze and Analytics may evolve:
“There is a chance that analytics within the new Buffer UI will evolve as we continue to build out Analyze [ ] The official decision on what to do there is TBD, pending customer research and usage data.”
Give it a try
If you use Buffer, I recommend you click on the Analyze icon in Buffer, and sign up for an early look. You will get a 14 day trial for free which should be good enough to tell you if Buffer Analyze will meet your analysis and reporting needs.
